I have been working on changing a couple things for the X2. Since I am driving the car backwards, the front steering (now the back) needs to be turned around to keep the correct steering geometry. I turned the steering around 180 degrees. I also got some trailing front axles to keep excessive twitching of the steering to a minimum. I also changed the caster to -4 degrees.
I got an Eagle Tree Micrologger data acquisition system. This plugs in-between the Thunder Power batteries and Castle HV-110 speed control and can accurately measure a multitude of things. Currently it is measuring battery voltage, current, watts, mAh used, motor rpm and will include the airspeed sensor in the future.
I am also working on machining wheels out of aluminum. As you can see from my previous tests, I am having a hard time keeping the foam on the standard plastic rims. I want to experiment with some machined rims and different foam types to see if I can make a wheel that will hold up to the extreme performance of these speeds.
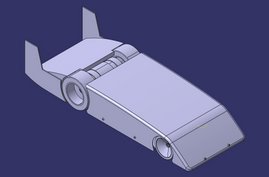
I am also working on a setup to provide downforce on the front wheels. My lack of acceleration is due to the fact that the coefficient of friction is lower than I expected. One way to increase traction without changing foam compound and increasing the weight of the car is to increase the downforce.

Here is a shot of the front suspension. It has been reversed to obtain the correct geometry. I installed trailing axle steering blocks to minimize the steering reaction. I also removed 1 set of washer from underneath the suspension arm mounts to increase the rear ride height to approximately 8mm. The upper arm mount shims were moved to provide -4 degrees of caster.

This is the Eagle Tree data acquisition micrologger. This will help me accuratley monitor voltage, speed, motor rpm and amp draw.

This is a sample graph of what the Micrologger can do. This example was from a quick bench test to see if everything was working. The car was freewheeling on the car stand. There seems to be some noise in the data. The only time the wheels were running is when you can see the rpm move into the 2 "humps" on the bottom of the graph. I was throttling up slowly to neutral then slowing down again. I did this twice. The data right before and after These rpm "humps" shouldnt be there since the motor wasnt even rotating. This could be caused by cogging of the brushless motor. You can see the rpm shoots up to 50,000 then goes to 0, which shouldn't happen.

Wheels being machined

 This is a rough mock up of how the wing will be placed on the car. Because the wing is so close to the ground, ground effect will increase the wings effective downforce coefficient.
 Profile view of the NACA 0006 airfoil showing different degrees of flap.